1. Create the graphic
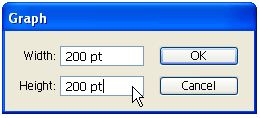
Select the
Pie Graph Tool 
, click on the Artboard/screen, then enter 200x200px.
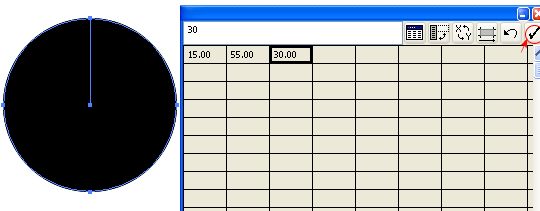
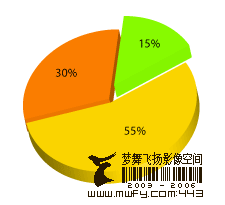
Data Table
Your graph data table will pop up like the image below. Enter 15, 55, 30 and then click on the check mark to apply data. You may close this data table now.
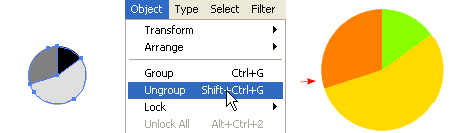
2. Ungroup the graph
You need to ungroup or break the graph in order to apply color and effects to each piece. With the graph selected, go to
Object > Ungroup or press
Ctrl+Shift+G. There will be a warning box(After a graph is ungrouped you will no longer be able to access its graph style, its data or change its graph designs.) just click Yes. Now
Ungroup again, first
Ungroup is to break the graph, second
Ungroup is to break the object into pieces. Fill with any color as you want and remove stroke color.
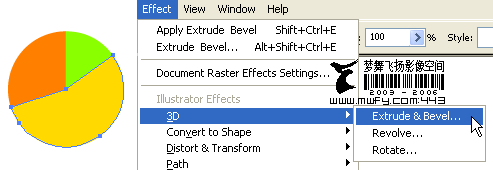
3. Apply Extrude & Bevel
Select any piece(I've selected yellow here), go to
Effect > 3D > Extrude & Bevel.
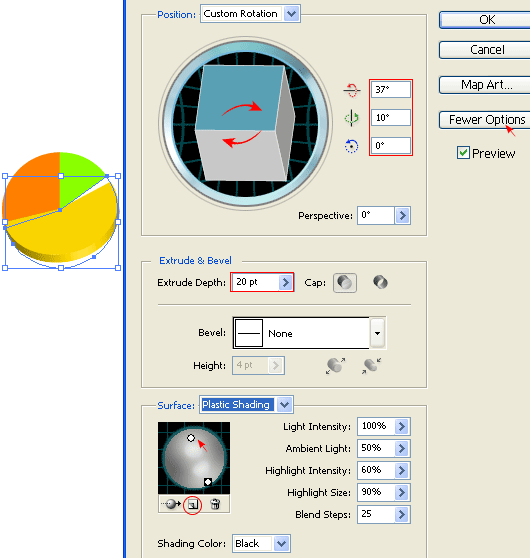
3D Extrude & Bevel options
If the lower portion window is not showing, click
More Options. Now you may drag the cube on the left to specify the Rotation or enter the
X-Y-Z Axis values manually. Enter 20pt for
Extrude Depth. Add an extra Light by clicking on
New Light icon and drag it as shown below.


 Download Source File (.ai)